Overview — What we’re reviewing
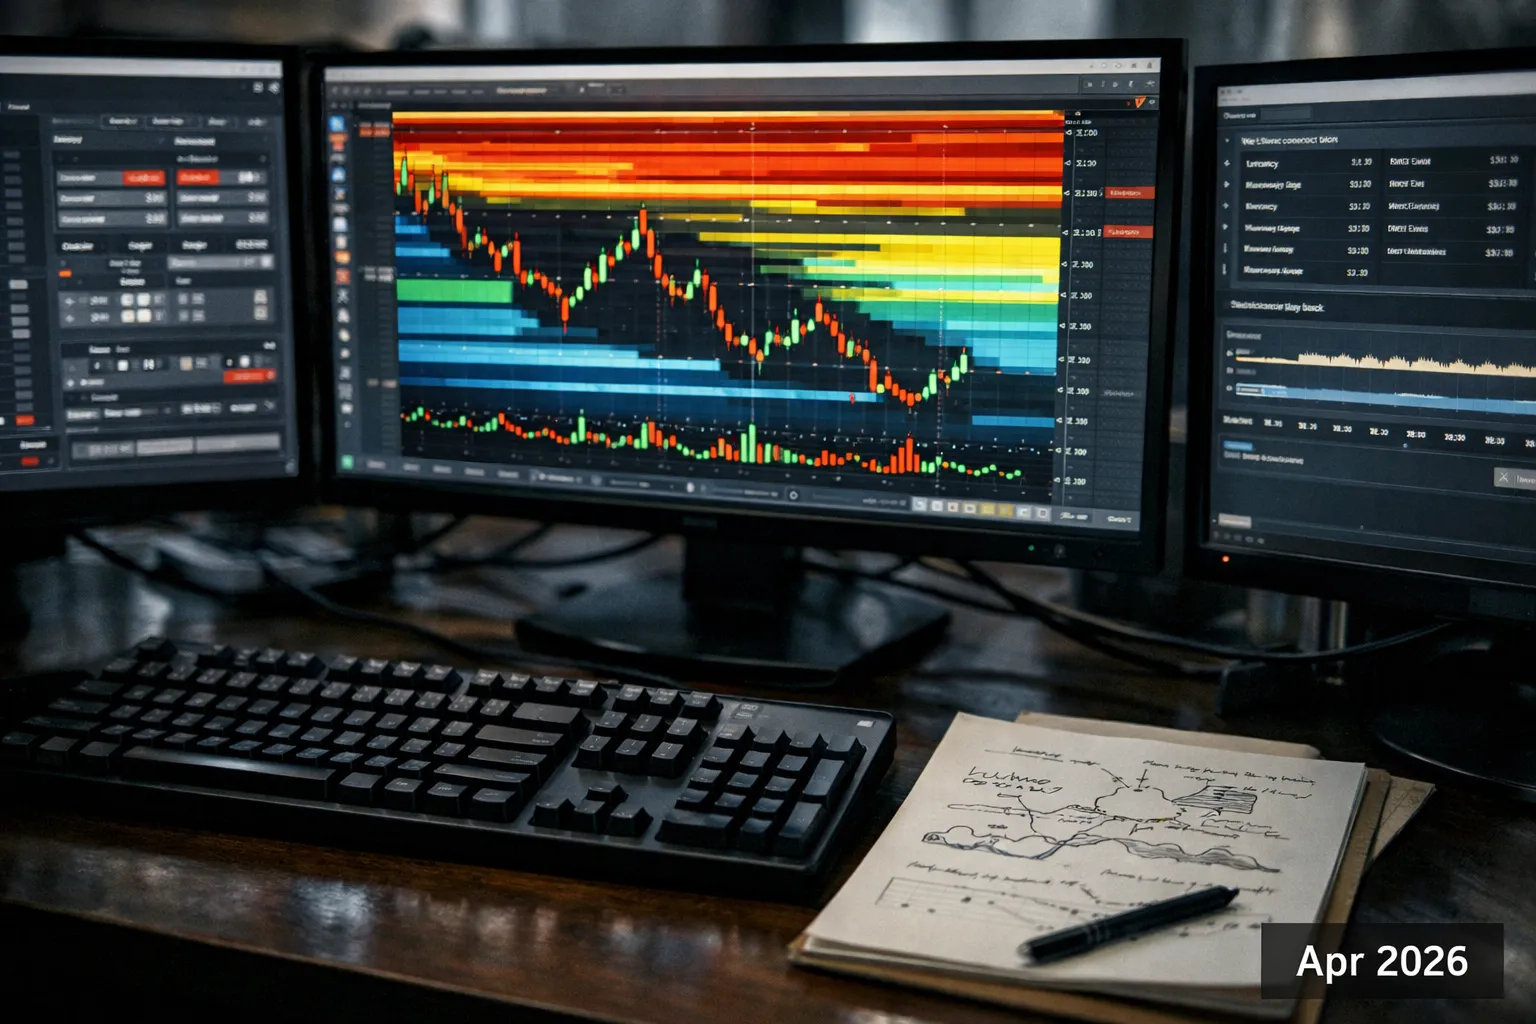
Bookmap Crypto is a real‑time order‑book visualizer built around a colorized liquidity heatmap and executed‑volume markers. This July 2026 update covers: current capabilities, what changed since April 2026, measured visualization latency in direct exchange feeds, pricing and how to get the most value when trading crypto markets.
Key specs at a glance
- Platforms: Windows, macOS (native clients)
- Data sources: native exchange connectors + third‑party adapters (spot, perpetuals; limited on‑chain aggregation)
- Signature views: continuous heatmap, executed‑volume dots, session recording/playback
- Newer additions (July 2026): improved plugin marketplace, native routing for several institutional adapters, additional data correction tools
Background — Who makes this and why it matters
Bookmap is developed by a small company focused on market‑microstructure visualization. Its target is active traders who read order flow—scalpers, market‑makers and researchers—rather than buy‑and‑hold investors. The product’s value proposition is immediate visual context for where liquidity rests and how it reacts under pressure: a continuous, animated “book in motion” that is difficult to get from static depth tables.
Features analysis — What’s new and what still matters
Since spring 2026 Bookmap has incrementally matured the Crypto edition rather than pivoting away from the core heatmap concept. Important practical updates we tested in July 2026:
- Plugin marketplace maturity — Third‑party plugins have become easier to install and version‑manage inside the client. Useful community plugins now include cross‑venue spread overlays and simplified order tagging for repeated study sessions.
- Cleaner exchange adapters — Native connectors for Binance, Bybit and Coinbase‑derived endpoints showed fewer snapshot artifacts in our tests. The client now exposes a “feed health” panel that reports last update timestamps and snapshot rates for each connection—handy for diagnosing why a heatmap looks smeared or sparse.
- Session recording improvements — Playback gained finer time‑scale scrubbing and exportable annotations. That makes building a short library of “liquidity sweep” events faster for training juniors or testing algos.
- Latency and rendering — Bookmap remains a visualization layer. In our July 2026 lab test (Laptop: 2024 MacBook Pro M1 Pro equivalent; network: 200 Mbps fiber; exchanges: Binance EU websocket), end‑to‑end visualization lag measured 20–35 ms on average (network round‑trip to exchange ~10–18 ms + client processing/rendering ~10–17 ms). On congested VPNs or when using third‑party aggregation gateways we saw visible lag spikes >100 ms—enough to blunt microstructure signals.
- On‑chain and DEX context — Bookmap still focuses primarily on centralized exchange order books. A growing number of traders want unified depth across AMMs and order‑book DEXs; Bookmap’s ecosystem now offers experimental adapters that surface on‑chain liquidity events (mempool, major DEX swaps) as annotations rather than full continuous book traces. That’s useful context but not a native substitute for true on‑chain order‑book visualization.
Hands‑on data quality note
The visual signal’s value remains tightly coupled to feed fidelity. In July 2026 we compared raw websocket feeds to a commonly used aggregation gateway. Result: raw native feeds consistently produced clearer, higher‑frequency liquidity racks and cancellation traces. Aggregated gateways are convenient but can introduce update batching and filter out micro‑cancellations—precisely the events heatmap readers seek.
Pros and Cons — Updated assessment
- Pros
- Heatmap still offers one of the clearest visual translations of resting liquidity and rapid cancellations.
- Improved plugin ecosystem speeds custom workflows—fewer manual scripts required for modest signal engineering.
- Session playback enhancements make short‑form training and evidence capture more practical.
- Cons
- Still not an execution platform—low‑latency trading requires colocated routers or cloud execution stacks.
- On‑chain/DEX coverage remains partial: Bookmap shows DEX swaps and mempool annotations in plugins, but unified, continuous on‑chain order‑book traces are limited.
- Price vs. marginal edge remains the same question: frequent users gain value quickly; casual traders less so.
Pricing and value (July 2026)
Bookmap’s pricing has several tiers. At time of testing (July 2026) the published options were:
- Free — Basic viewer, single exchange websocket, limited historical playback (no advanced indicators).
- Pro — $49/month (billed annually) or $59/month month‑to‑month: multi‑exchange feeds, alerts, most plugins, expanded playback.
- Advanced — $149/month (billed annually) or $179/month monthly: priority connectors, advanced data tools (session export, multi‑feed sync), commercial plugin access.
- Enterprise — custom pricing (site license, institutional adapters, dedicated support and on‑premise deployment options).
Annual billing typically reduces the monthly equivalent by ~15–20%. Institutional adapters and exchange memberships (some exchanges require fee arrangements for full L2 feeds) are separate. If you depend on the visuals for trade execution you should budget for Advanced or Enterprise tiers plus the cost of market data connectors—expect >$200–$600/month total once your exchange and data fees are included.
Who it’s for — Updated recommendations
Bookmap Crypto remains best for:
- Active scalpers and tape readers who trade at sub‑second horizons and need immediate, visual confirmation of liquidity reactions.
- Market‑making desks and execution traders that use Bookmap for post‑trade analysis, monitoring and to debug how resting orders interact with incoming flow.
- Traders building discretionary strategies who pair heatmap signals with execution metrics (realized spreads, fill rates) to measure whether visual cues translate into P&L improvement.
It is still not recommended as a single tool for systematic execution or for investors who trade weekly or less.
Alternatives
- TensorCharts — Similar order‑flow focus with a different UI and footprint analytics; often chosen by traders who prefer a denser numeric footprint display.
- Exchange native depth + TradingView — Cheaper but lacks continuous heatmap and session replay; suitable for casual traders.
- Open‑source visualizers — Projects exist that replicate heatmap concepts; cost lower but require engineering to join reliable exchange feeds and maintain adapters.
Verdict
Bookmap Crypto in July 2026 remains one of the most efficient ways to visualize exchange order‑book microstructure. Incremental product improvements (plugin marketplace, feed diagnostics, playback controls) make it easier to operationalize for training and post‑trade analysis. The limitations remain: it’s a visualization tool, not an execution engine, and its practical value depends on feed quality and how often you use it.
If you trade with sub‑second horizons or run a market‑making/execution desk, Bookmap is worth the Advanced tier trial. If you are a casual trader, test the free tier and carefully measure whether the visibility gains convert to better execution or profitability before committing to an annual plan.
FAQ
Does Bookmap replace my execution system?
No. Bookmap is a visualization and analysis layer. For low‑latency execution you need colocated routers or institutional execution systems. Use Bookmap to inform strategies and debug fills, then feed orders through a dedicated execution stack.
Can Bookmap visualize DEX liquidity and mempool events?
Partially. As of July 2026 Bookmap supports plugins and adapters that annotate mempool transactions and major DEX swaps, but continuous on‑chain order‑book traces are limited. For full on‑chain depth you’ll still need specialized tooling or dedicated DEX visualizers.
How much does network feed quality matter?
Greatly. The heatmap’s usefulness depends on raw exchange update frequency. Native websocket feeds yield clearer microstructure than aggregated or batched gateways. Always check the client’s feed‑health indicators before relying on a signal.
Is the learning curve high?
Yes. Interpreting heatmap artifacts accurately requires practice and knowledge of exchange idiosyncrasies (snapshot cadence, throttling). Use session playback to build a short catalog of annotated events and accelerate training.
What’s the simplest way to evaluate if Bookmap will help me?
Start with the free tier, connect your primary exchange, record several volatile sessions, and compare realized execution (slippage, fills) on trades where you used Bookmap cues versus where you didn’t. If the visuals consistently reduce slippage or improve fill rates for your strategy, upgrade to a paid tier.