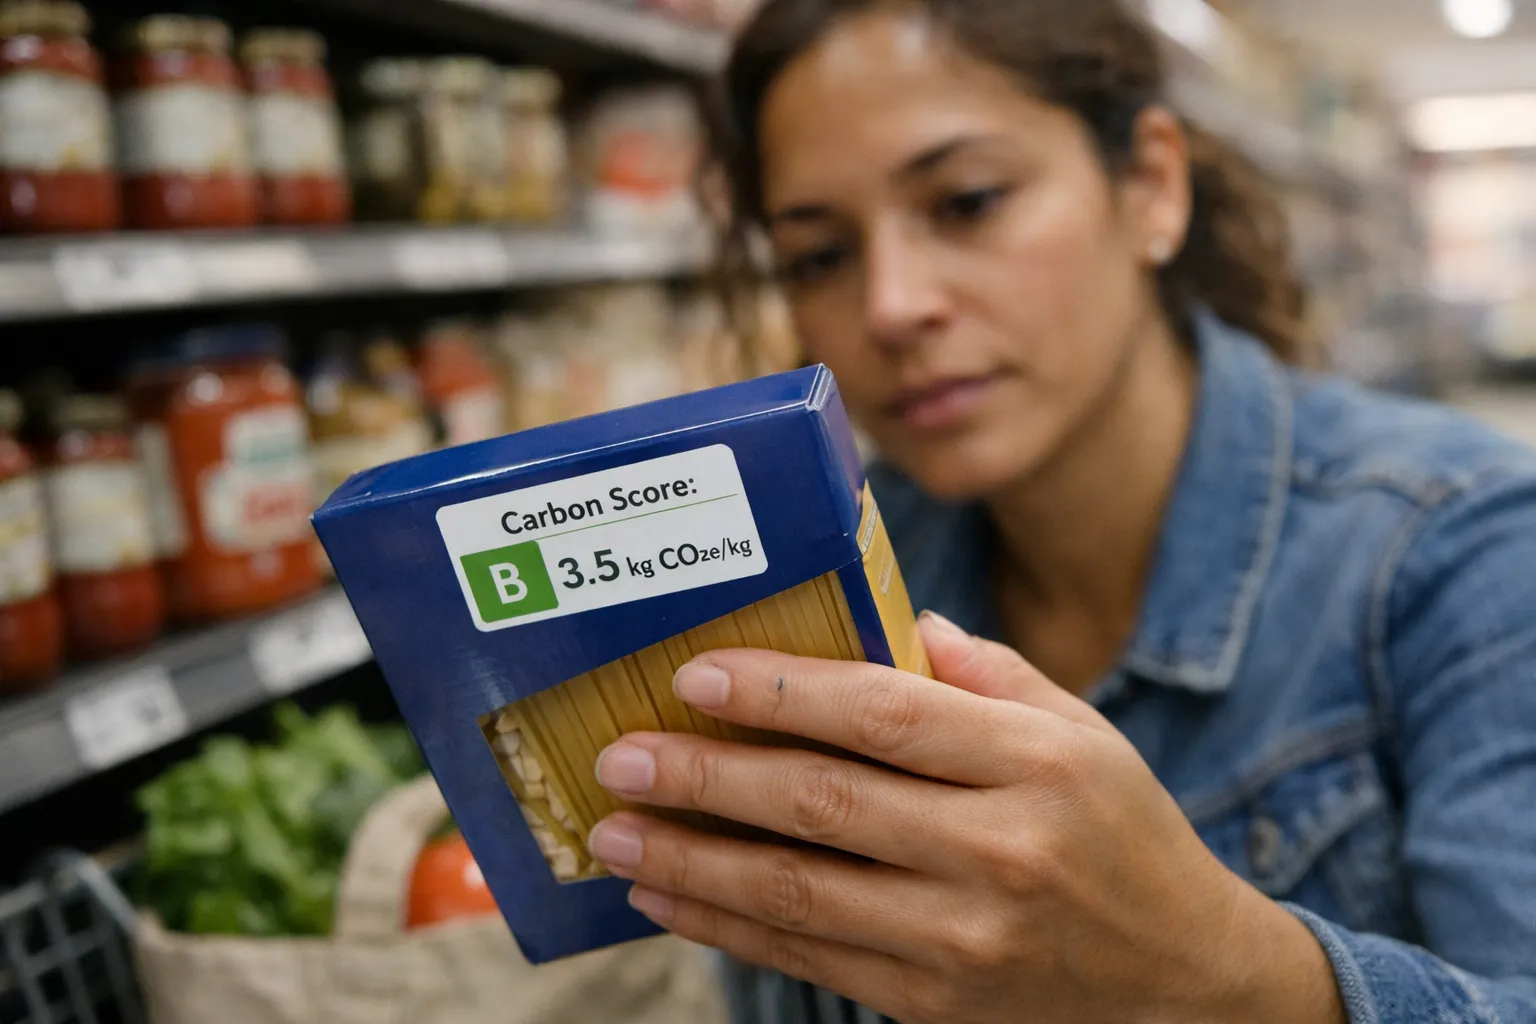
Who, what, when, where, why: As of August 2026, the industry‑led pilot to place on‑pack carbon‑footprint scores on packaged foods — first rolled out in May 2026 — has moved past the earliest test stores and into broader retail trials and online listings across multiple U.S. markets. Organizers say the aim remains the same: give shoppers a quick, comparable signal of greenhouse‑gas (GHG) emissions associated with a product’s supply chain. For home cooks, the change means more labels to notice, the first round of retailer recipe tools tied to scores, and clearer evidence about where simple swaps can cut meal footprints without wrecking flavor or the grocery budget.
Context: what’s happened since May 2026
The pilot started as a limited experiment in spring 2026 and, by mid‑summer, had broadened beyond a handful of test stores to include additional regional chains and expanded private‑label coverage in online catalogs. Retail partners have begun A/B testing label formats (letter grades versus numeric scales) and placing scores on product pages in retailer apps as well as on physical packs.
Policy actors are watching closely. The Federal Trade Commission (FTC) has reiterated longstanding guidance against deceptive environmental claims and signaled that any industry label seeking wide consumer adoption will need transparent methodology and third‑party verification to avoid enforcement risk. Several state consumer offices have requested methodological disclosures from pilot organizers; those disclosures are being posted in phases by participating companies.
New evidence and trends that matter to cooks
- Labels are becoming more comparable — but not yet uniform. Pilot partners have published more detailed life‑cycle boundaries for sampled categories. Many scores now clarify whether they include land‑use change, fertilizer emissions and refrigerated‑transport or stop at the processor gate. That transparency makes same‑category comparisons (e.g., two brands of canned tomatoes) more meaningful than cross‑category comparisons (tomato sauce vs. olive oil).
- Retail recipe tools launched. Several retailers have added “lower‑carbon” recipe filters to their websites and apps. These tools typically offer swap suggestions (half the beef swapped for cooked lentils, or olive oil swapped for canola in high‑heat uses) and show an estimated percent reduction in a recipe’s labeled footprint.
- Consumer response is pragmatic. Early engagement metrics released by pilot partners show shoppers click to view label explanations and swap suggestions at higher rates for protein and dairy categories than for staples like pasta. Anecdotal retailer reports indicate the labels are nudging some shoppers toward mixed dishes (e.g., beef‑lentil chili) more than complete elimination of animal products.
What the scores actually represent now
The basic LCA approach from the pilot remains: emissions are estimated across supply‑chain stages, normalized to a unit (kg CO2e per kg or per serving) and translated into a shopper scale (A–E or 1–10). Important clarifications added in 2026:
- Servings are now an explicit option. Several participants publish both weight‑based and per‑serving scores to help cooks compare foods more usefully when planning meals.
- Cook‑stage emissions remain excluded. Most pilot scores still do not include the emissions associated with home cooking (energy used in ovens or stovetops), so the labels are a supply‑chain signal, not a total meal footprint.
- Third‑party checks are underway. Independent reviewers contracted by some retailers have completed interim audits of methodology adherence; those audit summaries are being released to the public in redacted form.
What this means for home cooks — practical takeaways
For cooks who plan menus, manage budgets and want to reduce dish‑level emissions without compromising taste, the mid‑2026 rollout brings tangible opportunities:
- Use per‑serving scores for recipe planning. When available, choose the per‑serving metric to compare protein sources more fairly (for example, compare 4 oz servings of beef to 4 oz servings of tofu or lentils).
- Start with high‑impact proteins. The clearest wins remain portioning red meat and lamb. Try "meat‑as‑flavor" approaches (smaller amounts of high‑quality meat, bulked with mushrooms or lentils) in burgers, tacos and pasta sauces.
- Follow retailer swap guidance but test in your kitchen. Retailer recipe swaps are optimized for texture and flavor; use them as a starting point and adjust seasoning and moisture to taste rather than treating swaps as step‑by‑step replacements.
- Watch for seasonal and local modifiers. Some labels now carry metadata flags (seasonal, sourced domestically) — factor those into decisions if you prioritize local sourcing or seasonality over absolute carbon numbers.
Limitations and what to watch out for
Despite improvements, significant caveats remain:
- Method variation still affects comparisons. Two products in the same aisle may have different system boundaries — check the methodology panel before assuming an A‑grade is inherently better than a B‑grade from a different brand.
- Nutrition and cost aren’t encoded in the score. A low‑carbon product can be less nutritious or more expensive; balance environmental goals with dietary needs and your pantry budget.
- Small labels, big confusion risk. Shoppers report difficulty reading small text on packs. Retailers are testing in‑app "info" taps that expand methodological details to address this.
Reactions from stakeholders
"Carbon scores are useful if they are transparent and accompanied by real choices for shoppers," said a pilot industry spokesperson in July 2026. "We're committed to publishing methodological details and supporting recipe tools that make swaps practical."
Consumer advocates continue to press for independent verification and standardized disclosures. Meanwhile, several food manufacturers have begun public timelines for supplier engagement and low‑carbon sourcing trials — moves that could change product formulations over the next 18–36 months.
What’s next — timelines and what to watch
Pilot organizers have indicated they will publish an interim report in Q4 2026 summarizing consumer behavior metrics, methodological harmonization progress and recommendations for next steps. Expect these milestones:
- Q4 2026: Interim pilot report with behavior metrics and methodology summaries.
- 2027: Possible expansions to fresh produce and deli categories if methodology challenges can be resolved.
- Ongoing: Greater use of per‑serving scores, more in‑app recipe tools, and broader third‑party audits.
The bottom line for Home Chef Delights readers
As of August 2026, on‑pack carbon‑score labels are more visible and more usable than they were in May, but they are not yet a universal, fully standardized metric. For home cooks, the practical value is real: use per‑serving scores where offered, start with protein swaps and leverage retailer recipe guidance. Keep an eye on the pilot’s Q4 interim report for clearer comparisons and broader retailer commitments.
Will the labels tell me the healthiest choice?
No. Carbon scores show estimated supply‑chain emissions only. Use them alongside nutrition labels and dietary guidance — a low carbon score is not a nutrition claim.
How should I compare two different products with different score scales?
Look for the methodology or "about this label" link. Prefer comparisons within the same scale (A–E vs. 1–10) and the same system boundaries (whether land‑use change or fertilizer emissions are included). When in doubt, compare within a category (cheeses, canned tomatoes, ground beef) rather than across dissimilar foods.
Can I rely on retailer recipe swaps to preserve flavor?
Yes as a starting point. Retailer swaps are designed to maintain texture and flavor, but you may need to adjust seasoning, fat and cooking time. Test the swap in one recipe before converting family favorites.
Do carbon scores include emissions from my oven or stovetop?
Generally no. Most pilot scores exclude consumer cooking energy and focus on production, processing, transport and packaging. To estimate full meal emissions, add household energy use separately.
Where can I find more guidance and updates?
Watch participating retailers’ websites and apps for label explanations and recipe tools, and look for the pilot’s interim report expected in Q4 2026 for consolidated findings and methodological disclosures.