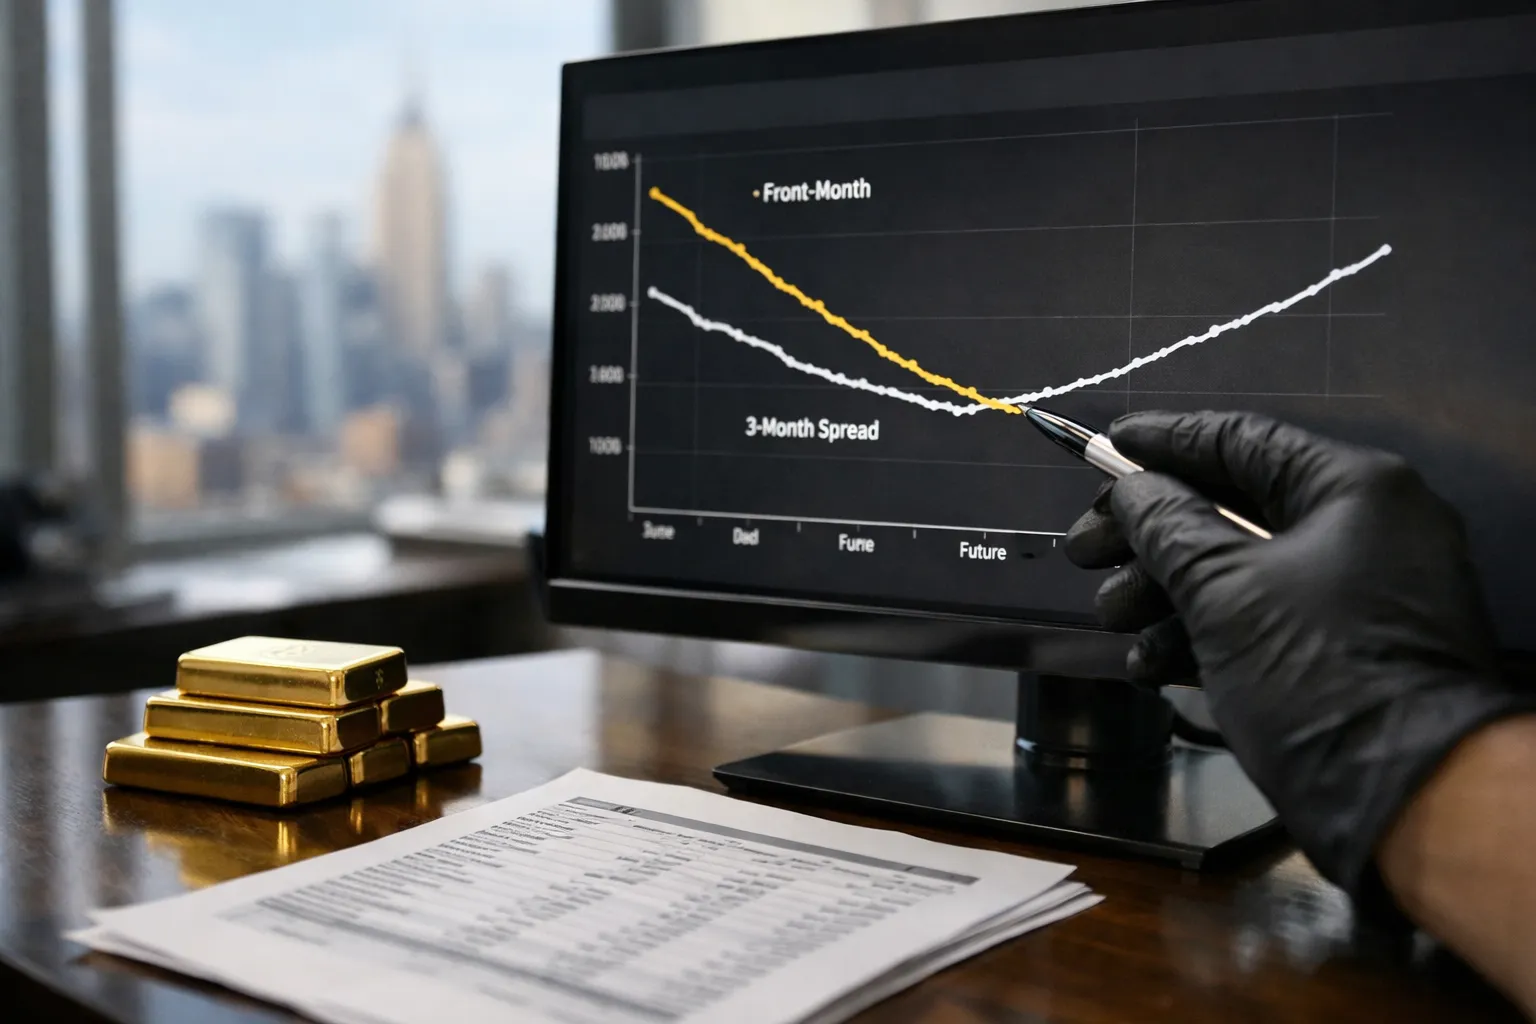
Why the gold futures curve matters. For long-term gold investors the spot price is central, but the shape of the futures curve—whether it is in contango (futures above spot) or backwardation (futures below spot)—encodes information about physical availability, funding conditions, and costs that directly affect returns for holders of bullion, ETFs and futures strategies. This analysis explains what drives the curve, how to read it, and what concrete actions investors should consider when the curve shifts.
How the curve is formed: supply, demand and financing
The fundamentals that determine the gold term structure are straightforward but interlinked:
- Physical supply vs demand. When available deliverable metal is ample relative to demand from buyers (jewelers, industrial users, retailers, ETFs, sovereigns), futures typically trade at a premium to spot (contango). Conversely, when demand outstrips immediate deliverability—during episodes of heavy central bank purchases, hoarding, or logistics bottlenecks—short-term futures can trade below spot (backwardation).
- Financing and carry. Holding physical gold has storage and insurance costs; those costs normally push futures above spot. Meanwhile, leasing markets and short-term financing rates (repo) influence whether traders prefer to own spot and lend it or take futures exposure instead.
- ETF creation/redemption mechanics. Large inflows or outflows into allocated-gold ETFs create needs for creation/redemption that change demand for physical metal and for futures. Market participants arbitrage between spot, futures and ETF shares; their behavior affects the curve.
Key measures investors should watch
To interpret signals correctly, track these observable metrics:
- Front-month vs multi-month futures spreads. Monitor the difference between the nearest futures contract and the three- or six-month contract (calendar spreads) on COMEX and relevant OTC forwards. A narrowing or inversion of front-vs-3m signals tightening.
- Spot-futures basis. The gap between spot and the nearest futures contract, expressed in dollars and basis points annually, shows short-term physical pressure.
- Physical premiums and delivery counts. Premiums for immediate delivery (retail coin premiums, vault spot premiums, or LBMA bar premiums) rise when spot-tightness is real. COMEX delivery notices and open interest give clues on whether futures are being used for genuine delivery.
- Short-term funding and repo rates. Rising repo rates or widening basis between cash and futures often reflect broader funding stress that can spill into gold.
- ETF flows and holdings. Inflows into allocated ETFs increase physical demand; sustained inflows alongside flattening or inverted curves confirm genuine tightening.
Patterns and what they signal
Interpreting the curve requires context. Here are common scenarios and their practical meaning for investors:
- Persistent contango with modest spreads. Normal market state: financing and storage costs dominate, no acute delivery pressure. ETFs and futures roll costs are predictable. For long-term holders, allocated bullion or low-cost ETFs are functionally equivalent; leverage via futures is costlier due to roll.
- Spike in contango (widening front-to-back spread). Often occurs when short-term supply increases relative to forward expectations (for example, seasonal scrap flows). A widening contango increases roll costs for futures or ETF share-issuing arbitrage and can make physically backed, allocated storage relatively more attractive.
- Occasional backwardation. A reliable signal of acute physical tightness or short-term delivery stress. Backwardation means traders are willing to pay to receive metal now rather than later. In such episodes, redemption of ETF shares or physical delivery can become expensive or rationed; holding allocated physical bullion or insured allocated accounts pays off.
- Volatile flips between contango and backwardation. This indicates episodic demand shocks or logistical frictions. Tactical moves such as increasing allocated holdings or trimming leveraged positions may be warranted until the market stabilizes.
Case study framework (how to apply real data)
Apply this checklist monthly or when volatility spikes:
- Pull the front-month and three-month futures prices on COMEX and calculate the annualized basis.
- Compare retail and wholesale spot premiums (coins, small bars vs 400 oz bars) to assess whether scarcity is retail-specific or sector-wide.
- Look at ETF flows for the last four weeks and changes in ETF inventories. Large, concentrated inflows into allocated ETFs paired with rising near-term premiums indicate structural tightening.
- Check gold lease/swap rates or synthetic financing indicators; if borrowing costs for gold climb relative to repo, that supports backwardation narratives.
- Review delivery notices and open interest—are contracts being held into delivery or closed out?
Practical implications for different investor types
Physical bullion investors
When the curve is in backwardation or near-flat, prioritize allocated, segregated storage and ensure counterparty terms allow prompt redemptions. Backwardation often coincides with higher retail premiums—buying during severe backwardation can be expensive, so consider buying in tranches or using trusted dealers with confirmed stock availability.
ETF investors
ETFs balance convenience and liquidity. In contango, ETF roll costs are modest; in backwardation, ETF providers may face higher creation costs or delayed allocations. Monitor ETF issuers’ inventory notes and whether they’re using lending to fund operations—this affects effective exposure. Be prepared for larger tracking errors during sharp term-structure shifts.
Futures and derivatives traders
Large contango favors carry trades (sell spot/ buy futures) only if storage and financing costs are well understood. Backwardation opens opportunities for near-term delivery arbitrage but increases delivery risk. Calendar spreads can express view on carry costs; tightness increases front-month value relative to deferred months.
Risk management and operational checks
- Confirm redemption terms and lead times with custodians and dealers—what used to be a 2–5 business day process can lengthen in stress.
- Evaluate counterparty credit and the insurer’s track record for claims related to loss or theft.
- Use position sizing to limit exposure to short-term market microstructure risk—especially when relying on derivatives rather than allocated metal.
- Keep a watchlist of logistical constraints: major refinery outages, shipping disruptions or regulatory changes that could tighten cross-border flows.
Putting numbers in perspective: expected impact on returns
The exact drag or boost from the term structure depends on strategy. For a bullion investor measuring total return over a year, persistent contango may shave 0.1–1.0% annually from synthetic futures exposure due to roll costs and financing, while backwardation can result in a temporary premium capture for spot holders but raise acquisition costs. For ETF investors, tracking error during turbulence can exceed typical management-fee differentials—so operational transparency from providers is crucial.
Conclusion: the curve as a real-time diagnostic
The gold futures curve is more than an abstract market metric; it is a high-frequency diagnostic of supply availability, financing conditions and operational strain. Savvy bullion investors use it to decide between allocated metal and ETF exposure, to time purchases or redemptions, and to size derivative positions. Regular monitoring of futures calendar spreads, spot premiums, ETF flows and funding indicators gives practical, actionable insight—especially in episodes of market stress when the difference between paper and physical gold becomes most consequential.
Actionable checklist: track front-vs-3m spreads weekly, monitor retail vs wholesale premiums, verify custodian redemption practices, and reduce leverage when the curve flips toward inversion. That disciplined approach converts the curve from an arcane market statistic into a decision-making tool for long-term gold portfolios.