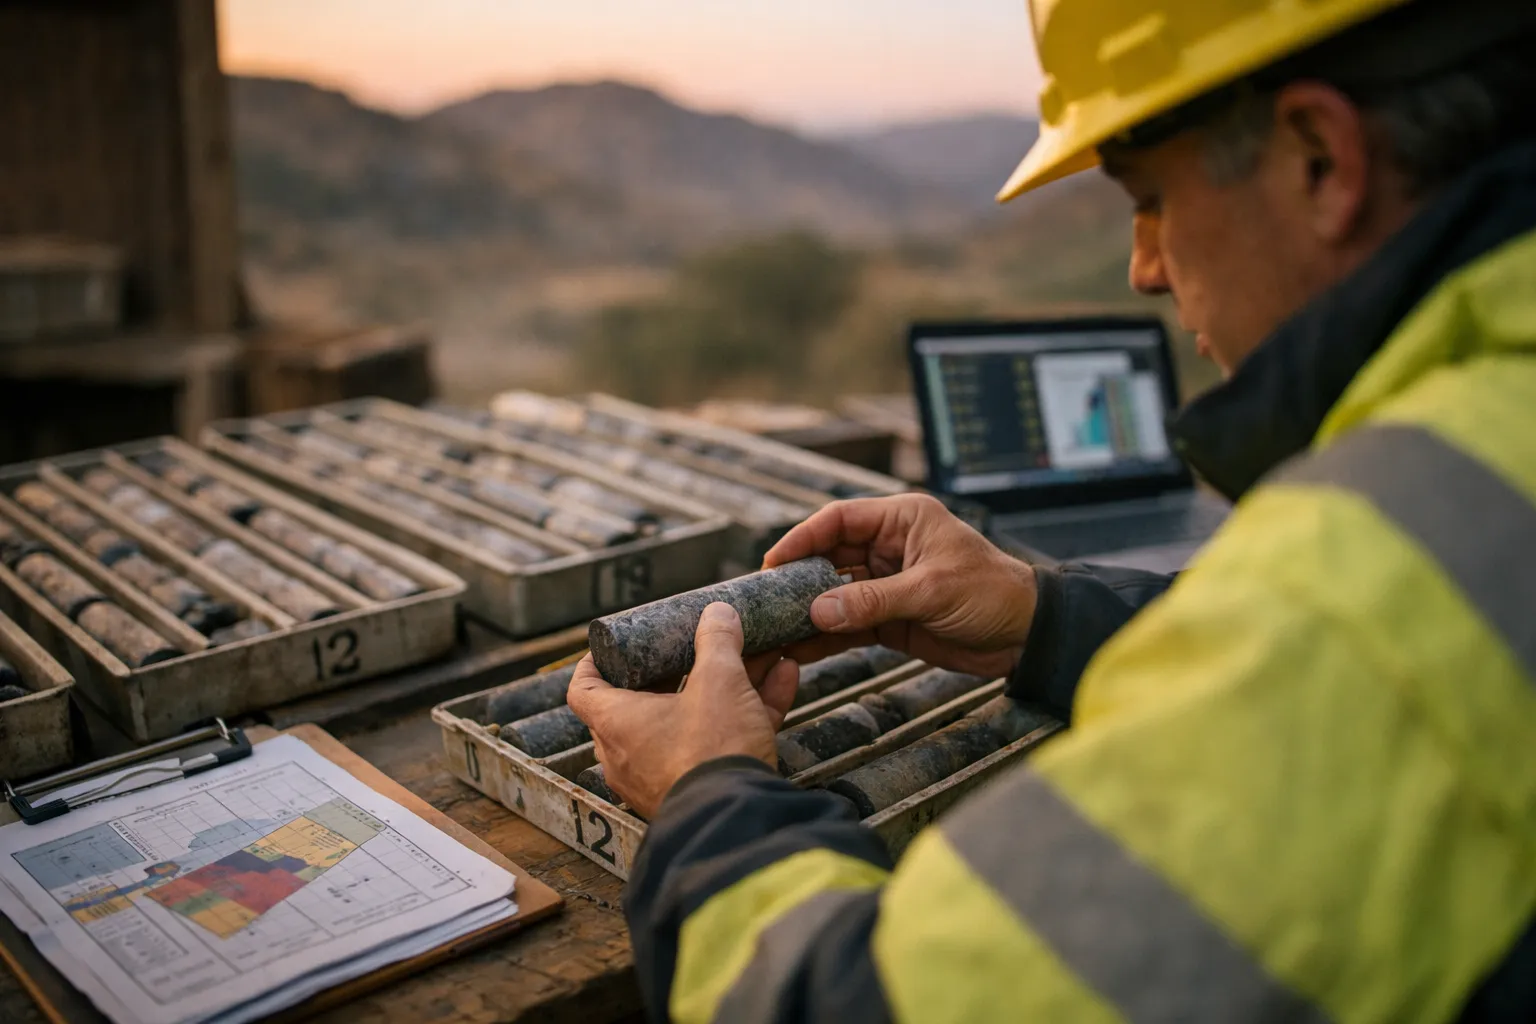
The gold market’s near-term price moves often attract the most attention, but structural forces beneath the surface — namely the long decline in new gold discoveries and rising costs to turn ore into marketable metal — deserve equal scrutiny. For gold investors, these supply-side dynamics are a slow-burning catalyst: they change the long-term balance between above-ground stocks, annual mine production and physical demand. This analysis unpacks the discovery trend, its drivers, the mechanics that delay new supply, and actionable implications for investment allocations heading into the remainder of 2026.
What’s happened to discoveries?
Over the past three decades the industry has recorded a clear fall in exploration success. Global discovery volumes — the total ounces identified in new deposits — have trended lower, while the frequency of “Tier 1” discoveries (large, high-grade, low-cost projects) has diminished. Exploration budgets spiked in the late 2000s and again briefly in the mid‑2010s, but overall output of commercially viable new projects has not kept pace with historical norms.
Two facts explain much of this: (1) the low-hanging fruit already has been found in accessible, low‑cost settings; and (2) the most prospective remaining jurisdictions are often more remote, deeper, metallurgically complex or higher‑risk politically — all of which raise discovery and development costs.
How discovery quality has changed
- Average ore grades are generally lower for new finds versus legacy mines, increasing the unit cost to produce the same ounce of gold.
- Strip ratios — the amount of waste rock removed per tonne of ore — have increased at many new and expanding operations, adding to mining capital and operating expenses.
- Many recent discoveries are smaller and require significant processing or concentrator upgrades, stretching capital requirements and timelines to production.
Why supply is slow to respond
Even when exploration does succeed, converting a discovery into commercial production takes years — typically 6–12 years for less complex projects and sometimes longer when permitting, financing or infrastructure build-out are difficult. That long lead time means the global supply curve is lumpy and slow-moving. Several mechanisms amplify the lag:
- Project economics and discipline: After the late‑2010s industry reset, many large producers prioritized returns over growth. That has restrained greenfield capex and turned producers toward brownfield expansion and M&A.
- Permitting and social license: Environmental reviews and community engagement add years in many jurisdictions, particularly where water, biodiversity or indigenous rights are involved.
- Capital availability: Large-scale mine builds require financing that is harder to secure in uncertain market cycles, especially for projects in higher‑risk countries.
How big is the gap — and why it matters for prices
Annual global mine production is on the order of a few thousand tonnes (roughly 3,000–3,500 tonnes per year in recent years), while the stock of gold above ground is measured in the hundreds of thousands of tonnes. That large above‑ground stock makes gold uniquely different from industrial commodities — replacements for lost production can come from recycling and existing inventories for many years. However, recycling flows are cyclical and responsive to price and household balances; they do not automatically replace mined ounces at scale on a predictable schedule.
Because new mine supply is slow to scale and discoveries are fewer and smaller, the supply side is less elastic than many investors appreciate. In a market where demand (jewellery, ETFs, central bank buying, industrial) is stable or rising, reduced discovery and slow project pipelines raise the prospect of a tighter structural market over a multi-year horizon. That tightness tends to favor a premium to gold’s spot price — and supports mining-equity upside when priced for discipline rather than growth.
Data cues and metrics investors should watch
Rather than chase headlines, disciplined investors monitor a set of supply-side indicators that signal long-term pressure:
- Discovery volumes and grade trends: Quarterly or annual reports from major industry trackers show ounces discovered and average grade. Sustained declines are a red flag for future supply.
- Reserve replacement ratio: Compare annual production to additions to proven and probable reserves. Ratios below 100% over multi-year stretches mean mines are depleting their asset base faster than it’s being replenished.
- Exploration spending and greenfield vs brownfield split: A higher share of brownfield spending suggests fewer new deposits are being sought and found.
- Time-to-first-production: Look at the pipeline of advanced projects and their estimated development timelines. Delays or cancellations materially shorten forward supply visibility.
- All-in sustaining costs (AISC) and strip ratios: Rising cost metrics compress margins and increase the break-even price required to justify investment.
Implications for investors — scenarios and strategies
Below are three plausible supply-driven scenarios and recommended positioning for gold investors.
Scenario A: Continued supply discipline — higher structural floor
If exploration remains constrained and reserve replacement stays below production, the market could develop a higher structural price floor. In this case:
- Physical bullion and long-dated bullion ETFs become more attractive as insurance against a rising structural premium.
- High-quality producers with low AISCs and strong balance sheets typically outperform; look for companies with proven reserve replacement and low political risk.
- Junior explorers with district-scale potential can offer asymmetric returns but require strict risk management (small position sizes, staged funding).
Scenario B: Demand shock offsets supply limits
Unexpected demand shocks (large central bank purchases or a surge in jewellery demand in key markets) could tighten the market rapidly. In this scenario, liquidity premiums and physical delivery premiums could move sharply higher — a boon for physically backed instruments and miners able to ramp production.
Scenario C: Recycling and above-ground stock cushion the market
If sustained price rallies trigger large recycling flows or sales from other holders, the market could absorb supply shortfalls with smaller price response. This would keep gold’s volatility moderate but still support miners with operational leverage to higher prices.
Practical allocation checklist for 2026
For gold-focused portfolios considering the structural supply story, a practical checklist:
- Maintain a core allocation to physical gold (allocated or reputable ETFs) sized for your hedge objectives, not speculative returns.
- Tilt a portion of equities exposure toward low-cost, cash-generative producers with disciplined capital allocation and visible reserve lives.
- Use small, opportunistic positions in development-stage projects and juniors, focusing on jurisdictions with pipeline infrastructure and clear permitting pathways.
- Monitor discovery and reserve-replacement indicators quarterly; adjust equity exposure if replacement ratios deteriorate further.
- Consider staggered exposure with some long-dated call options on bullion or miners to express a convex bet on a multi-year tightening scenario without full spot exposure.
Conclusion
The steady decline in new gold discoveries and the rising complexity — and cost — of bringing deposits into production create a quieter but powerful supply-side story for gold investors. It does not guarantee an imminent, explosive price rally; instead, it raises the odds of a tighter market and a higher long-term price floor, particularly if demand remains robust. For investors, the right response blends conviction in physical gold’s insurance properties with selective equity exposure to disciplined, low-cost producers and a careful watch of discovery and reserve metrics. In a market where new supply is costly and slow, patience and selective positioning can be rewarded.