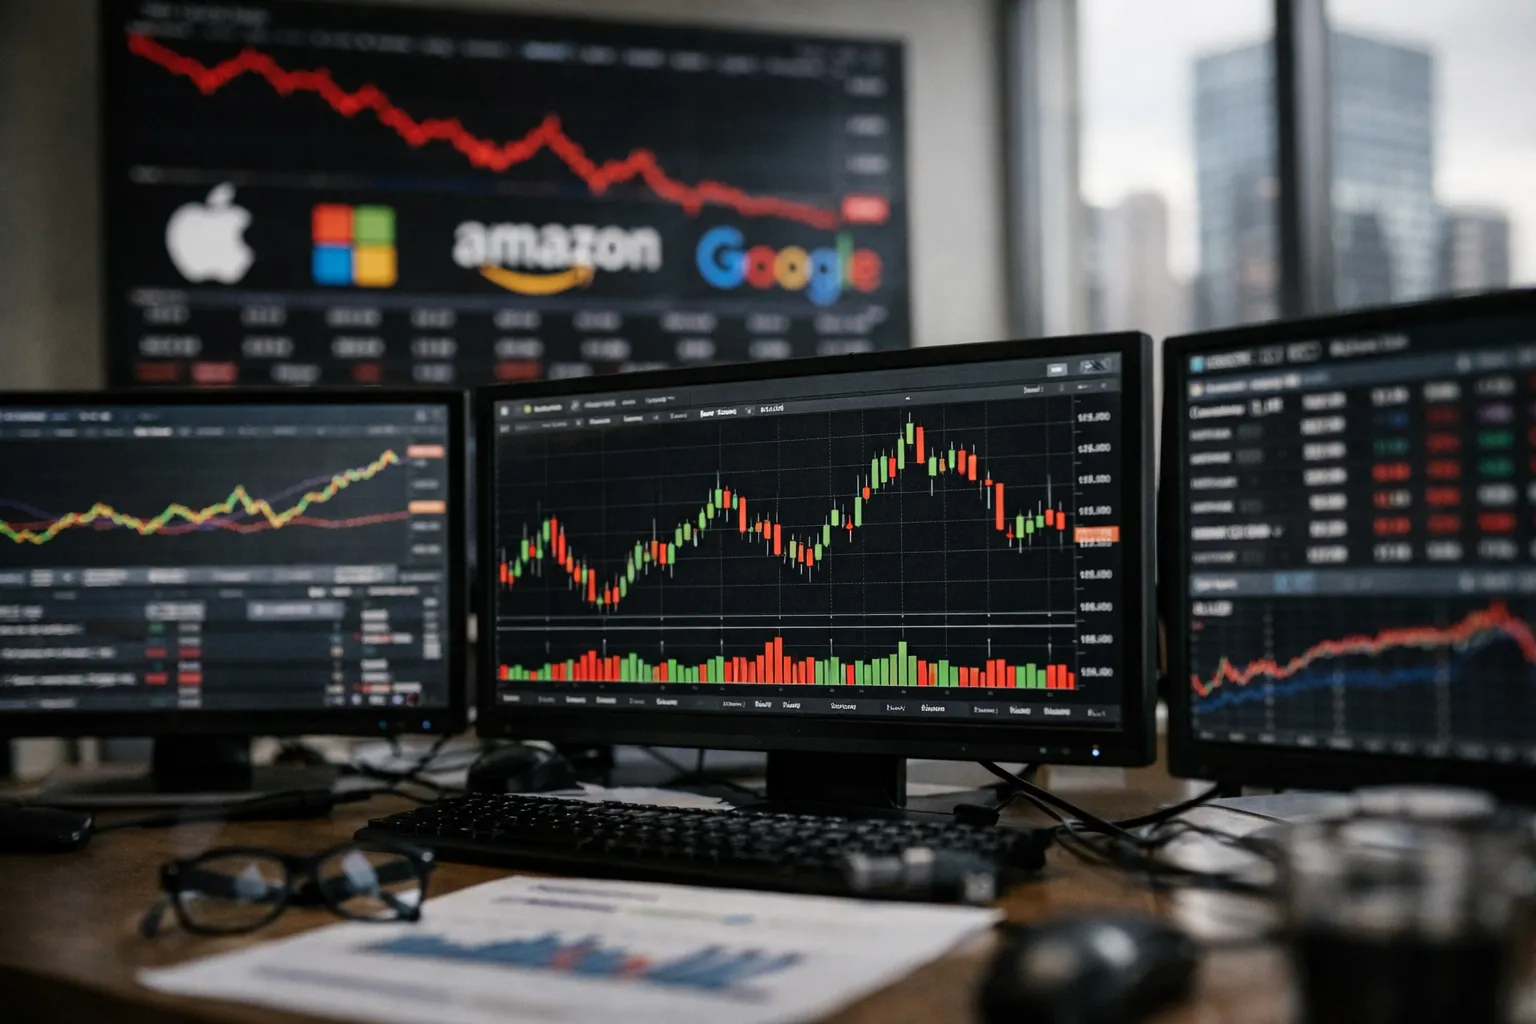
Overview: In September 2026 the familiar paradox remains: headline indices such as the S&P 500 and Nasdaq‑100 continue to outpace the median stock, driven by a handful of mega‑cap firms. That divergence matters for anyone who treats the index as “the market.” This update reviews what has changed since mid‑2026, presents fresh evidence on breadth and flows, and gives concrete, actionable monitoring and portfolio adjustments investors can implement immediately.
Background: how we got here and why it still matters
Concentration—the share of index market capitalization and returns attributable to the largest names—has been structurally higher since the cloud, platform and generative‑AI investment cycles began. Market‑cap weighting mechanically increases exposure to winners: when the largest companies rally, cap‑weighted benchmarks can produce strong headline returns even when most constituents don’t participate.
Through 2024–2026, that dynamic has been amplified by three forces: continued product‑level scale economics (especially in AI compute and cloud services), persistent retail and institutional flows into thematic and cap‑weighted ETFs, and a macro environment that intermittently favored long‑duration growth. The result for many investors is hidden single‑stock risk and distorted performance signals from the headline indices.
Data and evidence (what’s new as of September 2026)
- Mega‑cap leadership remains dominant: The same small group—Nvidia, Microsoft, Apple, Amazon, Alphabet (and in some periods Meta)—continues to explain a disproportionate share of index gains. Broad market‑cap data and index committee updates through mid‑2026 show that returns over multi‑month windows were frequently concentrated in these names rather than widely distributed across the S&P 500.
- Breadth has been mixed but fragile: Advance‑decline lines and percent of S&P 500 names above the 200‑day moving average have experienced more frequent divergence from index returns in 2026. Several short, sharp periods of leadership rotation (March and June–July 2026) produced wider dispersion, with small‑cap and value sectors briefly outperforming before flows reversed into mega‑cap growth again.
- ETF and mutual fund flows accentuate concentration: Flow trackers and asset manager disclosures in 2026 show sustained inflows into large cap and AI‑thematic ETFs while many small‑cap and plain‑value funds saw net outflows. Those flows have the mechanical effect of reinforcing market‑cap winners over time.
- Active manager performance and tracking error: With narrow leadership, many active large‑cap managers that underweight the biggest constituents recorded larger tracking error and lagged in short windows. Conversely, contrarian value and small‑cap managers posted periods of notable outperformance when breadth improved.
Multiple perspectives: what market participants are saying
Market strategists and portfolio managers remain divided:
- Index proponents (large passive managers) argue that concentration reflects genuine fundamental dispersion—some companies have wider moats and higher cashflow growth—so cap‑weighted exposure is the most efficient way to harvest long‑run market returns.
- Active and diversification proponents (many pension and endowment CIOs) counter that passive exposure without explicit concentration monitoring hides idiosyncratic risk and can materially alter portfolio outcomes when leadership rotates.
- Quant researchers emphasize flows and feedback loops: ETF inflows amplify winners; liquidity provisioning and options market activity around mega‑caps increase short‑term volatility and can accelerate rotation once sentiment shifts.
Why this matters for investors now
Concentration changes three practical things for everyday investors:
- Risk profile: Portfolios that look diversified on paper can have outsized single‑name and sector exposures that show up in crises.
- Return attribution: Performance measurement and goals should separate index beta from idiosyncratic contributions—otherwise investors misread skill versus passive market structure.
- Strategy choice and cost: Rebalancing, factor tilts, and hedges behave differently in concentrated regimes versus broad participation regimes; costs and tax consequences matter more for tactical moves.
How to measure concentration — updated metrics investors should track
The core metrics from earlier 2026 remain valid; below are concrete, repeatable indicators to compute weekly or monthly, with notes on interpretation:
- Top‑5 and top‑10 market‑cap share: Check the percentage of total index market cap attributable to the five and ten largest firms. A rising series over several weeks signals growing concentration; sharp reversals warn of rotation risk.
- Cap‑weighted vs equal‑weighted return spread (3‑month and 12‑month): Compare S&P 500 index returns to the S&P 500 Equal Weight ETF. A persistent cap‑weighted premium over equal‑weight indicates narrow leadership.
- Advance‑decline cumulative line and percent above 200‑day MA: If the index is new‑highing while breadth is deteriorating, leadership is narrow and fragile.
- New 52‑week highs vs lows and leader turnover: Track how many new 52‑week highs are concentrated among the same names and how often the top 50 contributors to daily returns rotate. Low turnover signals entrenched concentration.
- ETF flow imbalance: Net flows into mega‑cap and thematic ETFs relative to small‑cap and value ETFs. Significant and persistent net inflows into mega‑cap ETFs often precede wider concentration.
Updated recommendations and tactical playbook (Sept 2026)
Everything below is intended as pragmatic guidance for investors who want to remain invested but reduce the risk that a handful of mega‑caps determine outcomes.
Monitoring checklist (weekly)
- Top‑10 market‑cap share for S&P 500 (plot change week‑over‑week)
- 3‑month cap‑weighted vs equal‑weighted return spread
- Advance‑decline cumulative line and % above 200‑day MA
- Net ETF flows into top‑10 cap exposures vs small‑cap/value sleeves
- Options open interest and implied volatility skew for top‑5 names (spikes can presage concentrated risk)
Portfolio adjustments (practical)
- Small tilt to equal‑weight: Replace 3–8% of a core cap‑weighted allocation with an S&P 500 equal‑weight ETF (RSP or equivalent) to mechanically reduce exposure to the largest names without large trading costs.
- Add breadth sleeves: Allocate 2–6% to small‑cap or value ETFs (IWM, IJR, VTV or similar) to increase participation when leadership rotates.
- Use rebalancing rules: Rather than market timing, adopt rule‑based rebalancing: e.g., rebalance monthly or quarterly and trim cap‑weighted exposure if top‑10 share exceeds a pre‑set threshold for two consecutive months.
- Cost‑aware hedges: For investors needing downside protection, short‑dated index puts, dynamic collars, or small allocations to low‑cost tail‑risk funds can be effective but require ongoing cost evaluation. Avoid continuous expensive hedging that erodes long‑term returns.
- Active managers and factor blends: If using active managers, ask for explicit tracking‑error budgets and stress tests under concentrated regimes. For factor allocations, maintain uncorrelated exposures (value + quality + momentum) and enforce disciplined rebalancing.
Implications and what to watch next
Concentration is not binary; it evolves. Signals that would likely matter in the next 3–12 months include:
- Persistent reversal in ETF flows away from mega‑cap/theme funds toward small‑cap/value funds.
- Sharpening divergence between cap‑weighted and equal‑weighted returns sustained for several months.
- Macro inflection: materially higher real rates or a meaningful deterioration in corporate earnings that narrows long‑duration growth premiums.
- Options market stress or liquidity compression around mega‑cap names that increases systemic volatility.
When multiple signals flip together, concentration‑driven rallies may reverse quickly and with outsized breadth expansion. For most retail investors, a lightweight monitoring system plus small, rule‑based tilts achieves most of the protective benefits without sacrificing participation in long‑term growth.
Outlook
Through September 2026, concentration remains a live structural feature of U.S. equity markets. It may persist as long as scale economies and AI‑driven revenue growth favor a handful of firms and passive flows continue. But history and market microstructure suggest concentration can unwind rapidly when breadth recovers or macro conditions change. Implementing objective monitoring, modest equal‑weight/small‑cap sleeves, and cost‑aware hedges gives investors a pragmatic way to stay invested while reducing the chance that a few mega‑caps determine long‑term outcomes.
FAQ
Is index concentration a reason to sell all my passive ETFs?
No. For most investors, capitulating to extreme tactical moves is unnecessary. Passive cap‑weighted ETFs remain low‑cost and efficient. The preferred approach is to add small, rule‑based tilts (equal‑weight, small‑cap, factor sleeves) and monitor concentration metrics rather than wholesale selling.
How large should my equal‑weight tilt be?
That depends on risk tolerance and time horizon. A pragmatic starting point is 3–8% of portfolio assets moved from cap‑weighted core to an equal‑weight sleeve. Backtest or model the impact relative to your objectives and rebalance quarterly.
Will concentration permanently lower long‑term returns?
Not necessarily. If concentration reflects durable fundamental outperformance by a few companies, cap‑weighted exposure can deliver strong long‑term returns. The risk is timing: short‑to‑medium‑term outcomes can be dominated by single‑name shocks, so diversification of exposures and disciplined monitoring matter.
Should I buy active managers who bet against mega‑caps?
Active managers that underweight mega‑caps can provide diversification in concentrated regimes, but they often underperform during narrow rallies. Seek managers with explicit, transparent risk budgets and demonstrated discipline across market cycles rather than managers simply “betting against the winners.”
Where can I get the concentration data mentioned here?
Use index provider reports (S&P Dow Jones Indices), ETF flow data from major custodians and data vendors (Bloomberg, Refinitiv, ETFGI), and breadth indicators from public market dashboards. Many brokers and investment platforms now surface top‑10 share and cap‑weighted vs equal‑weighted spreads as standard analytics.